> For the complete documentation index, see [llms.txt](https://docs.geodin.com/llms.txt). Markdown versions of documentation pages are available by appending `.md` to page URLs; this page is available as [Markdown](https://docs.geodin.com/visualization-layouts-and-reporting/creating-borehole-logs/customizing-log-layouts.md).

# Customizing Log Layouts

Log layouts are customized in the GeoDin graphics window: graphic elements are arranged inside object frames, organized on drawing layers, and tuned through the settings branches and layout interfaces described below. Creating the borehole log graphic itself - drawing the object frame, adding the element, defining the data source - is covered in [Creating Borehole Logs](/visualization-layouts-and-reporting/creating-borehole-logs.md).

## Working with frames, layers and layout lists

### Object frames

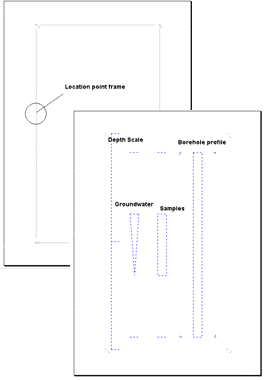
The object frame is the key element for the presentation of geological objects. It is used for combination (grouping) of the graphic elements of a geological object; an object frame therefore has to be drawn for each borehole if more than one borehole should be shown in one graph.

Using the tool, an object frame is drawn. The frame should be large enough to hold all the graphic elements. The selected frame is represented by 4 grey squares and 4 grey side lines; if not selected, the frame is represented by 4 grey angles.

The object frame is a special type - a further development - of the group frame. The selection of the object frame as the active graphic element is done with the mouse in the boundary area of the frame, or with the **Ctrl** key pressed at any place inside the frame. The special features for the scaling of group frames are also available for the object frames.

Inside the object frame the individual graphic elements can be arranged in any way. For example a borehole log and borehole table can be displayed in detail using the large number of possibilities for the labeling instructions. The geological graphic elements inside the object frame always refer to a borehole; the borehole to be shown is chosen by the object frame.

The behavior of the **Borehole log/Borehole tab** element inside the frame (page distribution, moving and scaling, multiple instances) is described in [Creating Borehole Logs](/visualization-layouts-and-reporting/creating-borehole-logs.md). The snap function is activated and deactivated using the menu entry **Preferences > Snap** or the shortcut **Ctrl+K**; it is described in [Layout Editor Basics](/visualization-layouts-and-reporting/creating-custom-layouts/layout-editor-basics.md).

**Converting an object frame**

An object frame can be converted into a (multi-) object frame and vice versa. Select the frame and open the context menu with a right-click on the frame, then select the entry **Convert object frame**. After a confirmation, the object frame is converted into the other type.

{% hint style="warning" %}
Some graphic elements (well design, groundwater, special symbols and samples) can only be used in an object frame, not in a multi-object frame - they are removed during conversion, and the confirmation window lists all removed objects. If the frame is linked to a dataset in the GeoDin object manager, the connection is also removed during conversion; re-establish the link by dragging the object onto the layout.
{% endhint %}

<figure><img src="/files/YmDDS4nnAr1qBFDZWRYx" alt="Object frame layout schematic"><figcaption><p>An object frame grouping the graphic elements of one borehole: one layout page highlights the location point frame; the second shows dashed placeholders for the depth scale, borehole profile, groundwater and samples elements.</p></figcaption></figure>

### Drawing layers

A graph can be arranged in different drawing layers. The drawing layers are used to divide the graphic logically into several parts - fixed title blocks, for example, can be drawn in an extra drawing layer to separate them from variable graphic elements.

The use of different drawing layers can be summarized as follows:

* Because only graphic elements of the current drawing layer can be selected, inadvertent editing of elements in other layers is impossible.
* If a large number of graphic elements is used (for example in a geological cross-section), elements can be found and selected more easily if they are distributed on several drawing layers.
* Drawing layers can be hidden, so temporarily disturbing graphic elements do not have to be removed from the graph. The construction of the image is faster if you temporarily hide unneeded elements.
* Drawing layers may contain information which is either exclusively shown on the display or when printing. This way certain contents can be shown for specific user groups or applications.

Each drawing layer has a name; the name of the current layer is displayed on the right in the status bar. Creating new drawing layers or changing the drawing area is done by selecting the menu entry **Arrangement > Drawing layer**, with the key combination **Ctrl + E**, or by selecting the branch **\<Drawing layers>** directly in the object properties. The dialog itself is described under *Drawing layers dialog* in the Reference section below.

### Layout lists

Layout lists and collections (`.GLL`/`.GLC`), their advantages and report sequences are described in [Layout Files and Lists](/visualization-layouts-and-reporting/creating-custom-layouts/layout-files-and-lists.md). Editing a layout list file takes place in the GeoDin graphics window (see [Layout Editor Basics](/visualization-layouts-and-reporting/creating-custom-layouts/layout-editor-basics.md)): open it either via **Open file** or - if the standard layout list is to be opened - via the button **Standard layout list**. Only a `.GLL` file can be declared as the standard layout list. In `.GLL` files, layouts can additionally be compiled into groups, e.g. to find a specific layout more quickly.

***

## Reference: layout settings and interfaces

The presentation settings branches **graphically**, **Main layers**, **Layer query** and **Individual conditions** for borehole logs are described in [Creating Borehole Logs](/visualization-layouts-and-reporting/creating-borehole-logs.md). Generic element properties (element name, drawing layer): see [Element Properties](/visualization-layouts-and-reporting/creating-custom-layouts/element-properties.md).

### Image element

The graphic element image can be used for company logos, topographic background for a ground plan etc. The following graphic formats are possible:

| Format                    | Extensions        |
| ------------------------- | ----------------- |
| Bitmap                    | `*.bmp`           |
| Windows Enhanced Metafile | `*.emf`           |
| Icon                      | `*.ico`           |
| JPEG                      | `*.jpeg`, `*.jpg` |
| GeoDin graphic files      | `*.ggf`           |
| Picture Exchange          | `*.pcx`           |
| Portable Network Graphics | `*.png`           |
| TIFF                      | `*.tiff`, `*.tif` |
| Windows Metafile          | `*.wmf`           |

After adding this element it is first shown with a blue dashed frame. The selection of an image is made in the branch **Data source**.

### Parameter

Select here a parameter from the available data types. You receive a selection dialog by clicking on the button right in the entry field.

### Text labeling

**Labeling with depth** - The depth values of the layer boundaries are placed left of the borehole log. Optionally the depth values can be displayed in m below surface or converted correlated to the ground level measurement point (**absolute**). The decimal places option allows you to set how many decimal places are shown (the default value is one decimal place, i.e. 12,4). The incline of the borehole can optionally be taken into consideration; the depth values are then recalculated using the entered angle of incline. For this, the data field which contains the angle of incline must be adjusted in the branch [Scale](/visualization-layouts-and-reporting/scale-bars-and-depth-scales.md).

**Labeling with layer data** - The layer data are added on the right side of the borehole log. If they consist of layer data with the option of component descriptions, it can be defined whether the labeling of the components is done in the depth in which the component is described. Choosing the option **Layer description only once**, a layer which is parted is only labeled once.

**Language** - The selection of a different language than the input language requires [Standards](/administration/ground-description-standards.md). The presentation of fill patterns is not influenced by the selection.

The (vertical) text orientation of the labeling can be chosen, as well as the line type of the tag lines of text related to the borehole log.

### Depth labeling (Text)

Controls how depth values are displayed alongside the borehole log:

* **Default** - Depth shown in metres below ground surface.
* **To Datum** - Uses the elevation entry to calculate height relative to datum (typically mean sea level).
* **Adjust inclination** - Recalculates displayed depths to vertical or horizontal using values from a specified data entry field (e.g. angle of inclination).
* **Decimal places** - Number of decimal places shown on depth labels.
* **Special text 1 / Special text 2** - Adds groundwater level information where supported by the object type. Only applicable to SEP1 object types where groundwater date information has been entered in the "Additional information" field of the layer description.
* **Font** - Select font, size, and other typographic attributes; the preview shows the current settings.
* **Background** - Set to *Transparent* to allow underlying graphic elements to show through character areas; set to *Opaque* to crop background content behind the text (default: white background, colour configurable).

### Tag lines (Tags)

Controls the visual style of the tag lines connecting depth labels or layer text to the borehole log:

* **Line type** - Select the line type for tag lines.
* **Color** - Choose from the dropdown; select "Individually" to open the full color dialog for a custom color.
* **Line thickness** - Set in mm (preferred for print accuracy) or pixels (screen-only use). When set in mm, the preview thickness may not match print output exactly.

### Layout interfaces

These layout interfaces offer setting options and are usable for layouts which contain the corresponding graphic elements:

| Interface         | Setting options for            | Usable for layouts containing                                                                                                                                                                                                                                                                     |
| ----------------- | ------------------------------ | ------------------------------------------------------------------------------------------------------------------------------------------------------------------------------------------------------------------------------------------------------------------------------------------------- |
| **Scales**        | Horizontal and vertical scales | [Borehole log](/visualization-layouts-and-reporting/creating-borehole-logs.md), [Well design](/workspace-and-data-management/creating-objects/well-design-data.md), [Data sequence](/importing-data/data-sequences.md), [Samples](/workspace-and-data-management/creating-objects/sample-data.md) |
| **Labeling**      | Text elements                  | [Text and Variable text](/visualization-layouts-and-reporting/creating-custom-layouts/text-macros-and-variable-text.md)                                                                                                                                                                           |
| **Data sequence** | Data sequences                 | [Data sequence](/importing-data/data-sequences.md)                                                                                                                                                                                                                                                |
| **Reports**       | Report elements                | [Measurement value graphic](/visualization-layouts-and-reporting/creating-custom-layouts/measurement-value-graphics.md)                                                                                                                                                                           |

### Drawing layers dialog

All existing drawing layers are listed here; the number of elements in each drawing layer is displayed in the second column. The current drawing layer is marked with a pen symbol. With the help of the boxes the visibility of a drawing layer can be adjusted.

The icons on the right side of the list are used for editing the drawing layers:

| Icon                          | Function                                                                                                                                                                                                                                                                                                         |
| ----------------------------- | ---------------------------------------------------------------------------------------------------------------------------------------------------------------------------------------------------------------------------------------------------------------------------------------------------------------- |
| **New drawing layer**         | A new drawing layer is created. A unique name has to be chosen.                                                                                                                                                                                                                                                  |
| **Delete drawing layer**      | The selected drawing layer is deleted after a security check. Deleting is also possible if the layer still contains graphic elements - deleting the drawing layer also deletes all its graphic elements.                                                                                                         |
| **Set current drawing layer** | The selected drawing layer becomes the current one (also possible by double-clicking the entry in the list). Invisible layers cannot be chosen as current drawing layers.                                                                                                                                        |
| **Properties**                | Change the name of the selected drawing layer and its visibility for screen and printer. It is also possible to enable the layer for the quick settings within the layout overview. The visibility options for screen display and for certain pages are only active in the layout overview, not in editing mode. |
| **Extended settings**         | All properties become visible within the list and can be deactivated with double-clicks.                                                                                                                                                                                                                         |
| **Access all layers**         | Generally no graphic elements can be selected from other (not current) drawing layers. If it is absolutely necessary to move graphic elements from different layers together, activate **Access all layers** - elements from all layers can then be selected and manipulated.                                    |

### Layout snippets

With the help of layout snippets individual layouts parts can be combined to make a completely new layout. These snippets can be standardized backgrounds, frames with company logos etc. Instead of drawing these elements in each layout, snippets can be integrated in the current layout to present information. GeoDin accomplishes this by saving a link to the snippet, rather than the snippet itself, so that any change made to the snippet is automatically reflected in all layouts where the snippet has been used.

To use snippets in the current layout choose the option **Use layout snippets** in the node 'Additional properties'. The branch 'Layout snippets' is then available to which snippets can be added. There is no limit to the number of snippets that a layout may contain and a snippet can be created from other snippets.

* **Name** - Give the snippet a name. Each snippet is automatically embedded in a special separate drawing layer (that is identified by this name).
* **Layout name** - Click in this field to choose the layout snippet file. The link to the file is saved with a relative path, hence snippets should be saved in the same folder or in sub-folders as the layouts. This ensures that layouts retain the relationship to their snippets even when the folder containing the layouts is moved. This is however only recommended practice and not obligatory - snippets can be stored in any folder, though this requires potentially more care.
* **Using layout snippets** - If a snippet is temporarily not required, it may be deactivated rather than deleting it from the layout. In this case it will not be loaded or calculated. If the drawing layer containing the snippet is made invisible, the snippet will not be shown, but will be loaded and calculated.
* **Bring to front** - The default setting places snippet elements in the background; this option allows them to be placed in the foreground.
* **Scale to page** - If a layout snippet has a different page size than the current layout, it will be added in the top left corner of the current layout, where it can be more easily scaled to fit the current page size. To achieve this the graphical elements must use **Anchors**, which control how scaling and positioning are carried out when changing the page size/orientation.

### Selection syntax

To describe parameter relations, string symbols are used like in labeling macros or formulas, for example `$NO3$` for nitrate. The condition has to contribute a logical result (true or false). Example for a condition (nitrate > 10): `$NO3$ > 10`. Several partial conditions can be connected with the logical operators AND and OR.

#### String fields and wildcards

For **string fields** `=` can be used for an exact analogy and `like` for a similarity. If `like` is used the comparison string can contain wildcards: the symbol `%` stands for several characters, `_` for one character. The search term `Bore%` finds all samples that start with "Bore"; `Borehole_` only finds those samples which have exactly one character behind "Borehole" ("Borehole 1" is found, "Borehole 10" is not).

#### The operator HAS

Additionally, for drawing series fields the operator **HAS** is allowed. It detects if a subordinate symbol series exists and is useful for fields with dictionaries in which more than one code can be entered, divided by commas. The syntax styles are:

```
1) $DATAFIELD$ Has 'Code'
2) $DATAFIELD$ Has ('Code')
3) $DATAFIELD$ Has ('Code1','Code2'[...,'Code'])
4) $DATAFIELD$ Has 'Code1,Code2,...,CodeN'
```

If more codes are entered in the `Has` condition, minimum one of the specified codes must be in the data field. This is equal to the formulation: data field has code 1 or data field has code 2 etc. If parentheses are used (styles 2 and 3) the search terms can contain a comma. If the single quotations are used (styles 1 and 4) the comma is the separator between several terms.

For the entry of search terms also **wildcards** are allowed. For example the condition `$DATAFIELD$ HAS '%'` is always true if any content is found in the data field. A comparison using `HAS '%'` results in false if the data field is empty. To receive a comparison result true if the data field has a content or is empty, use the operator `%ANY`: `$DATAFIELD$ HAS '%ANY'`.

For comparisons with data fields the following syntax is used: `$BOREBEG$>'20021021'` (date `yyyymmdd` in inverse commas).

#### Using AND and OR

**Using AND** - This operator creates a combined limitation. For example `($PH$>7) AND ($COND$>200)`: only the data sets which comply with both conditions, for example a pH value of 7,6 and a conductivity of 245, are available. If only one of both conditions is not fulfilled - for example pH 6,3 or conductivity 178 - the data set is not complying with the conditions and is not selected.

**Using OR** - This operator creates a completing limitation. For example `($PH$>7) OR ($LEITF$>200)`: only one of both conditions must be complied with. That means a data set with pH 7,6 and COND 245, as well as a data set with pH 6,3 and COND 245, and also pH 7,5 and COND 178, fulfills the conditions and is selected.

{% hint style="info" %}
When using the operators AND and OR, the single terms have to be enclosed in parentheses.
{% endhint %}

#### Selecting the dataset position

To select a particular dataset the variables `%FIRST` and `%LAST` can be used. The first or the last dataset of a queried series of datasets is supplied. By adding a numeric operator the position of the dataset to select can be moved. Example: `%LAST-1` supplies the dataset before the last dataset of a measurement series. If the dataset position is invalid, an empty data volume is returned.

Both operators cannot be combined (neither with each other, nor with any other terms). Selectors which contain the operators `%FIRST` or `%LAST` can be combined with other selectors. In this case the order of appearance is decisive, because the selectors are executed one after the other.

Example:

```
Selector1=$SMPDATE$<'199100101'
Selector2=%LAST
```

A subset of datasets is determined which originate from a date before the 1.1.1991. The last dataset of this subset is used.

```
Selector1=%LAST
Selector2=$SMPDATE$<'199100101'
```

The last dataset of the measurement value is selected. If it has a date before the 1.1.1991 it is valid; otherwise the result is empty.

#### Return result for syntax errors

If the selection contains a faulty data field reference or typing errors it cannot be calculated. Depending on how it is used, this can lead either to a display of all datasets (selection ignored) or no datasets at all (all datasets are invalid). By extending the syntax, the return result can be defined for these cases. This is helpful if the selections refer to data fields which not all used databases contain. This could be for example measurement value parameters, which can be selected individually for each database by the user and therefore can vary from database to database.

The syntax is `[OnError:Result=true]` or `[OnError:Result=false]`. The value in brackets has to be at the end of the string, and the `[OnError:...]` statement is not case sensitive. Example: `$DATAFIELD1$ ='v' [OnError:Result=true]` - the result of the query would be true if `DATAFIELD1` does not exist in the database. If the data field is there, the selection is true if the field content is 'v', otherwise the selection result is false.

#### Using the operator HASLOOP in reports

By writing `$DATAFIELD$ Has 'Code1,Code2,...,CodeN'`, all data which fulfill the selection are taken and displayed in a report in one step. To reach a group of datasets with an attribute, the operator **HasLoop** can be used. The syntax is identical to the operator `Has` and allows several spellings: `$DATAFIELD$ HasLoop 'Code1,Code2,...,CodeN'`.

Other than `Has`, the selection and the display of the datasets in the report create a loop, so that single reports are combined one after the other:

```
$DATAFIELD$ Has 'Code1'
$DATAFIELD$ Has 'Code2'
...
$DATAFIELD$ Has 'CodeN'
```

The result is a report which contains the datasets in the order of the group sequence. Using the [Footers](/visualization-layouts-and-reporting/creating-custom-layouts/report-elements.md) of a report, each individual group can be given additional information. Often there should be a header line with the group name above the dataset group: add a header of type 'text' and use the text macro `$%SelectorContent:Selector name$` (as selector name put the name of your HasLoop selector).


---

# Agent Instructions
This documentation is published with GitBook. GitBook is the documentation platform designed so that both humans and AI agents can read, navigate, and reason over technical content effectively. Learn more at gitbook.com.

## Querying This Documentation
If you need additional information that is not directly available in this page, you can query the documentation dynamically by asking a question.

Perform an HTTP GET request on the current page URL with the `ask` query parameter, and the optional `goal` query parameter:

```
GET https://docs.geodin.com/visualization-layouts-and-reporting/creating-borehole-logs/customizing-log-layouts.md?ask=<question>&goal=<endgoal>
```

`ask` is the immediate question: it should be specific, self-contained, and written in natural language.
`goal` is optional and describes the broader end goal you are ultimately trying to accomplish on behalf of the user. GitBook uses it to tailor the answer towards what is most useful for that goal.

The response will contain a direct answer to the question and relevant excerpts and sources from the documentation.

Use this mechanism when the answer is not explicitly present in the current page, you need clarification or additional context, or you want to retrieve related documentation sections.
